


 44 / 145

THE STATE OF THE EUROPEAN UNION
44
expansion have nothing to do with one anoth-
er? Apparently, in both cases we are referring to
public resources channelled into the European
economy. If that is the case, the key question to
consider is why monetary expansion and invest-
ment policy are approached in such a different
way as to give us such striking figures as the
ones we see above.
This backdrop is certainly worth some atten-
tion, particularly because of the fact that neither
public authorities nor experts nor the media
have taken the trouble to explain why, in view
of the impressive amounts allocated to the
European economy through monetary policy,
investment policy is obsessed with raising com-
paratively tiny budgetary resources and, what’s
more, the political narrative of our institutions is
built around the supposedly extraordinary effort
we are making through the Juncker Plan, while
we forget what is happening to more than 2.8
trillion euros channelled into monetary policy.
The usual line of argument is apparently sim-
ple. It is based on taking it for granted that
monetary policy and investment policy have no
direct interrelation and, therefore, must be ana-
lysed in clearly different ways.
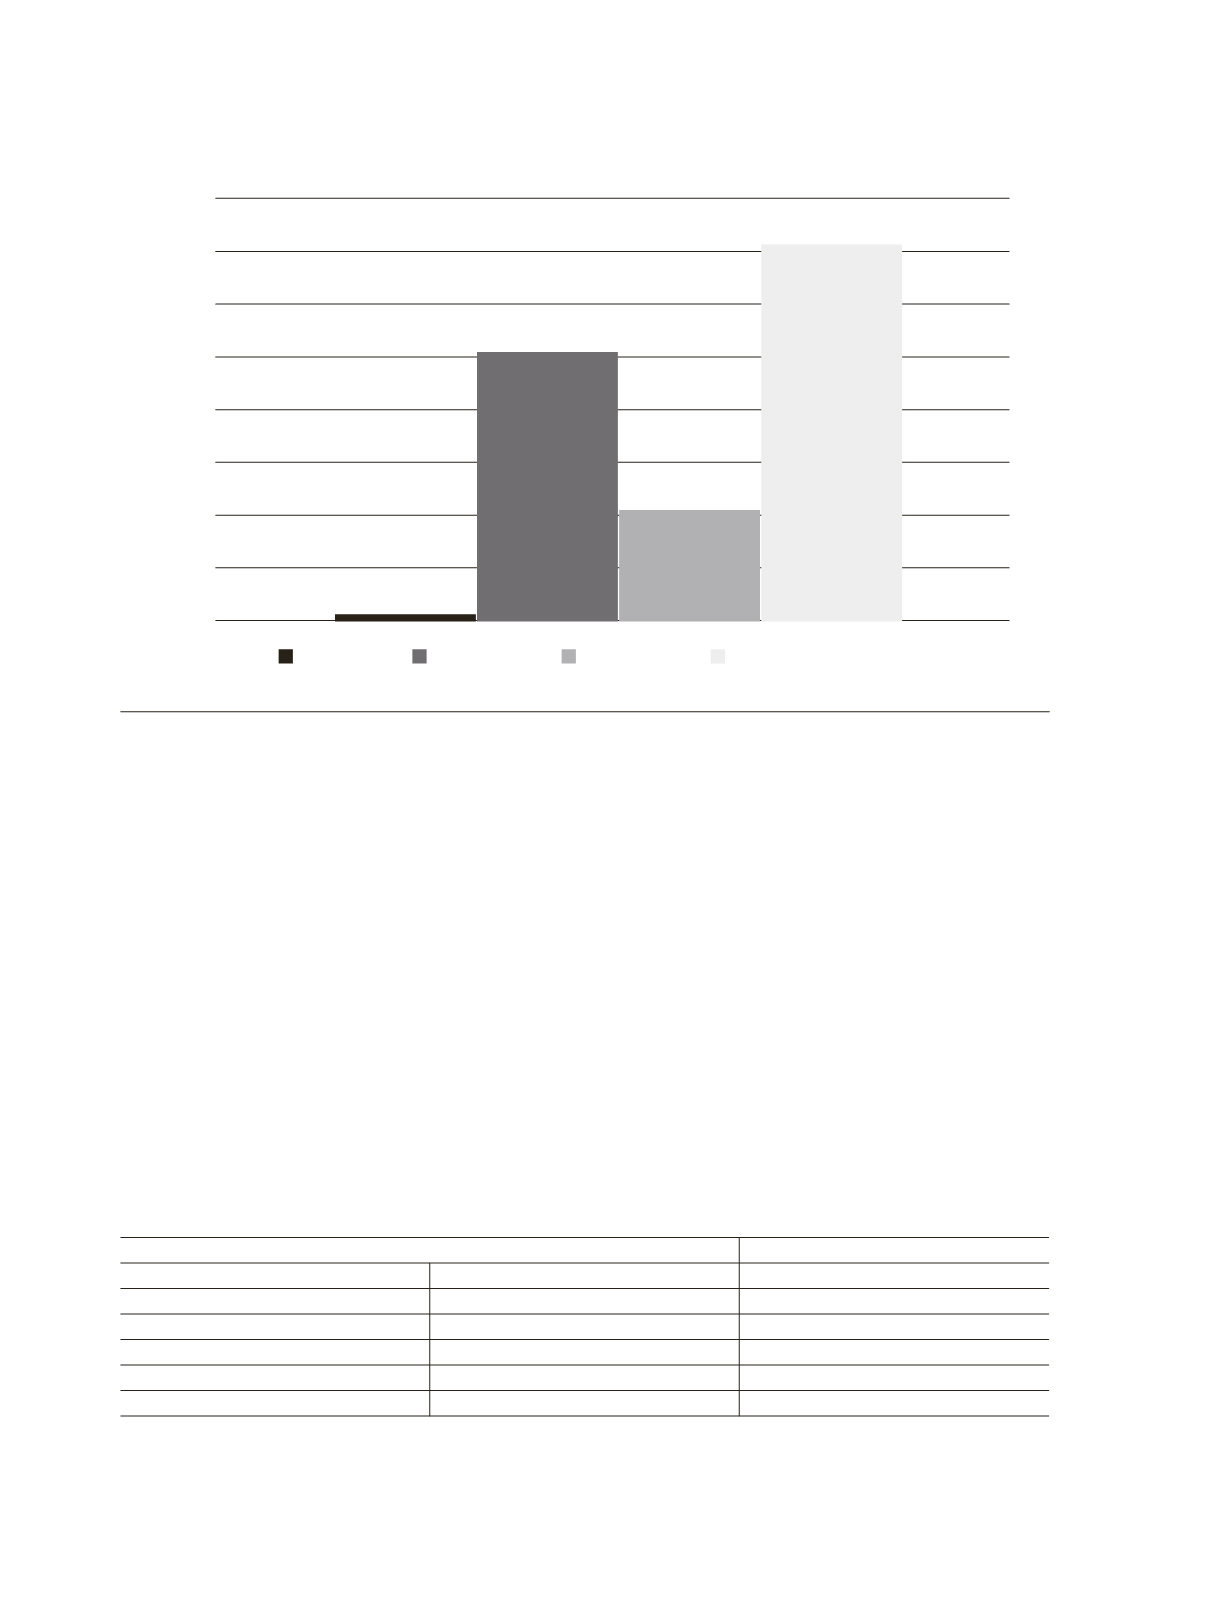
Chart 1.
Juncker Plan and long-term monetary expansion programmes (millions of euros)
1,600,000
1,400,000
1,200,000
1,000,000
800,000
600,000
400,000
200,000
21,000
1,018,500
1,424,588
417,300
0
Juncker Plan LTRO 2011-12 TLTRO 2014-16 APP programmes
Data to 31/01/2016.
Source:
European Commission/ECB/EKAI Center.
Table 1.
Eurozone’s GDP in 2014
Amount (
€
)
% GDP Eurozone 2014
Juncker Plan
21 billion
0.2 %
Monetary expansion programmes
2.860388 trillion
28.3 %
LTRO 2011-12
1.0185 trillion
TLTRO 2014-16
417.3 billion
APPs
1.424588 trillion
Source:
European Commission/ECB/EUROSTAT/EKAI Center