


 76 / 145

THE STATE OF THE EUROPEAN UNION
76
– Ireland was the catch-up star in the 1990-
2007 period, and rose from being one of the
poorest countries of the old EU to being the
second richest one (measured in GDP per
head). To this end, it followed a growth
model based on foreign investments, tax
concessions and export surplus. After 2000,
Ireland retreated slowly from this successful
model (at the expense of other countries,
which lost value added and tax revenues to
Ireland due to transfer pricing and other ac-
tivities of multinational corporations), and
experienced a real estate boom with a pro-
nounced increase of private debt. When this
new model imploded in the financial market
crisis and the Irish State bailed out its banks,
thus greatly increasing its debt, the result was
a deep recession. But Ireland was able to re-
turn to the previous growth model. Between
2008 and 2014, its GDP grew by 3.8 % de-
spite one setback by over 5 % between 2008
and 2009, that is, faster than the average of
the rich north-western countries.
What are the causes of these different
growth performances? The convergence behav-
iour (that is, the diminishing inequality between
countries) basically corresponds to the assump-
tions of the traditional growth theory, which
supposes that poorer countries (can) reach a
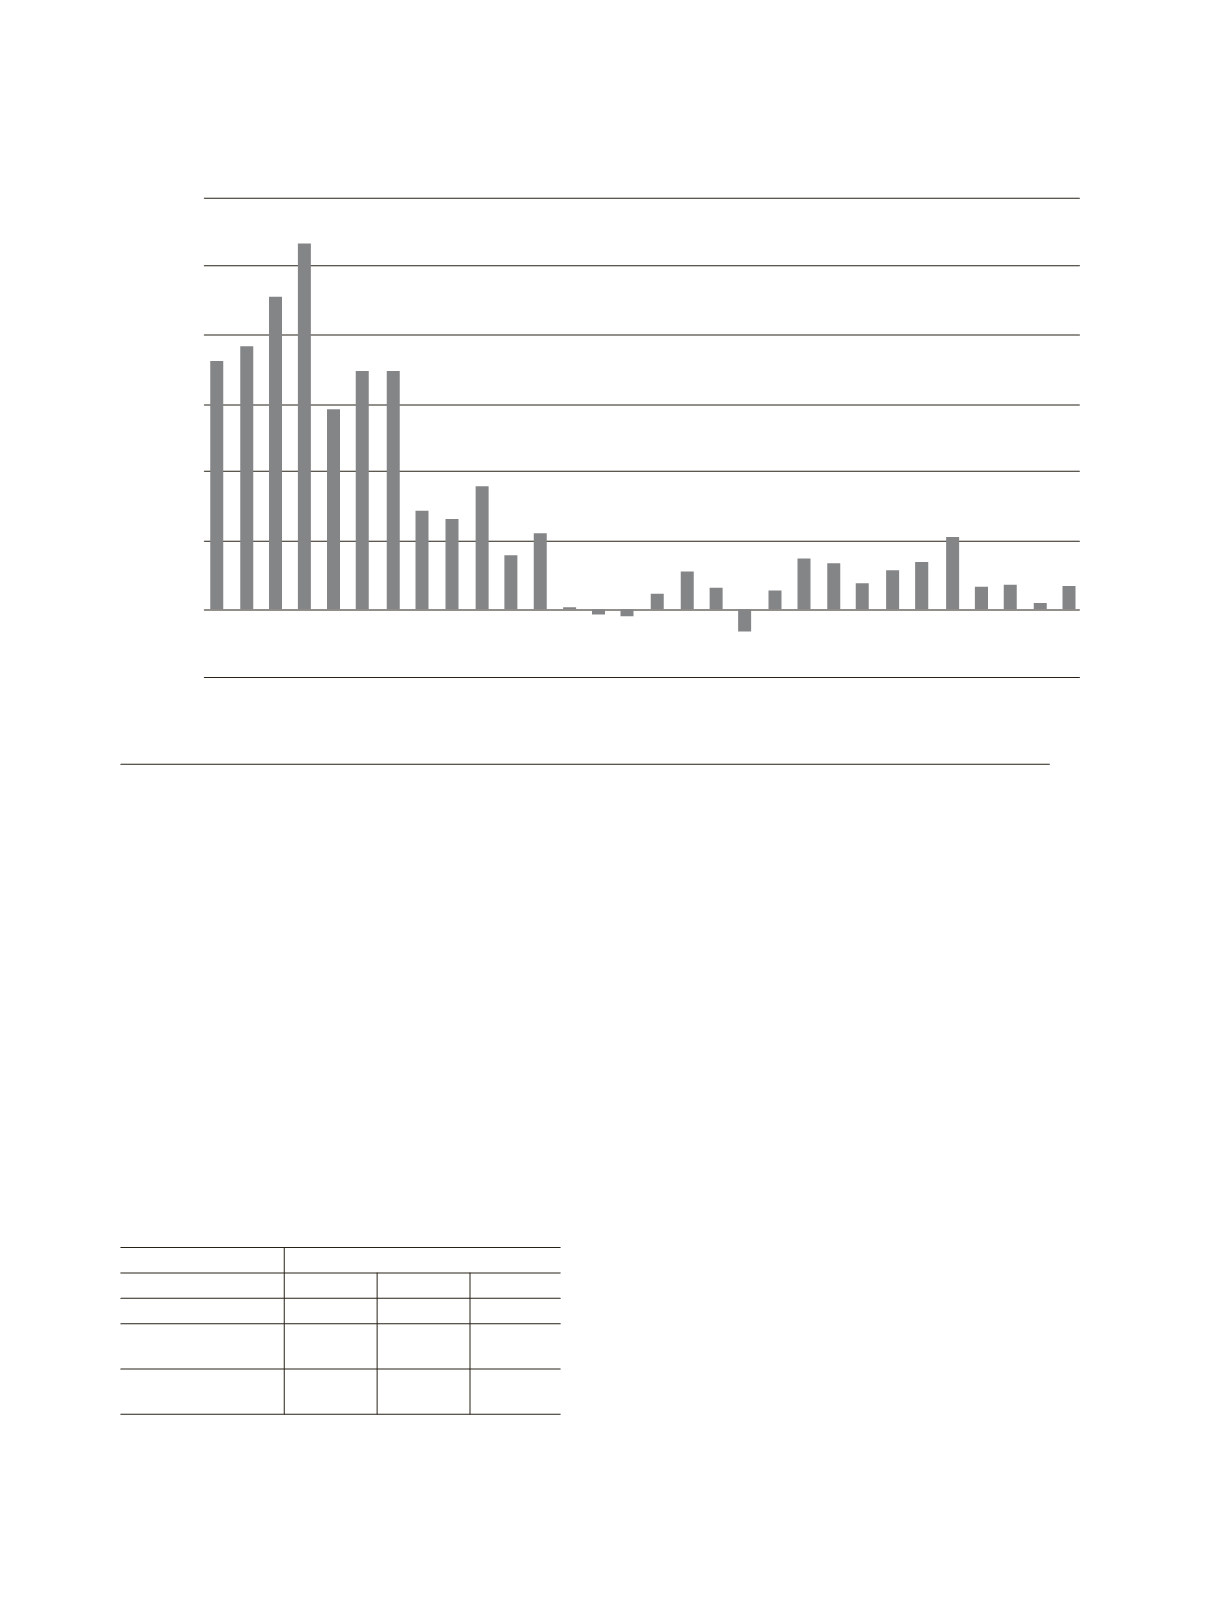
Chart 1.
Growth rates of income per head between 2000 and 2013 in percentage.
Source:
Eurostat; author’s calculations.
120.0
100.0
80.0
60.0
40.0
20.0
–20.0
0.0
Bulgaria
Romania
Latvia
Lithuania
Poland
Eslovakia
Estonia
Croatia
Hungary
Czech republic
Malt
Slovenia
Greece
Portugal
Cyprus
Spain
European Union (28 countries)
Eurozone (18 countries)
Italy
France
Germany
Finland
Belgium
United Kingdom
Austria
Sweden
Netherlands
Ireland
Denmark
Luxemburg
Table 1.
Development of real GDP 2000-2014
Change
Areas
2000-2014 2000-2008 2008-2014
Richer North and West
16.1 % 14.5 % 1.4 %
Poorer southern
periphery
13.7 % 26.8 % -10.3 %
Poorer new Member
States
52.4 % 43.8 % 6.0 %
Sources:
Eurostat; author’s calculations.