


 70 / 169

THE STATE OF THE EUROPEAN UNION
70
rejectionist with regard to integration. The find-
ings in this study confirm that persons who con-
sider themselves part of the upper strata are
significantly more pro-EU than members of the
lower classes. There are indications, however,
that these contrasting assessments of the EU
have abated somewhat. Since 2015, the basic
attitude towards the EU has not only changed to
the positive in upper classes in all eight countries,
but among the lower classes as well. In some
countries, like Germany and France, this shift has
even been strongest in the lower classes.
As rich in facets as this change in the image
of the EU to the positive would appear, it is also
underscored by notions people associate with
the Union. One of the most problematic find-
ings in the 2015 survey was that a majority of
citizens in all eight countries no longer associ-
ated the EU with growing, but rather declining,
prosperity. This negative assessment has now
fundamentally changed: a majority of citizens in
the eight countries (47 %) associate the EU with
rising prosperity once again, while only 35 link
it to declining prosperity (58 % in 2015).
This change in mood has manifested in all
eight countries, although on significantly differ-
ing scales. The EU once again stands for mount-
ing prosperity for clear majorities in Slovakia
(68 %/up 32 %), in Spain (62 %/up 24 %) and
in Germany (53 %/up 22 %). But also in
Sweden, the Netherlands and France, the no-
tion of Community once again conjures up as-
sociations of rising rather than decreasing pros-
perity. Even in the Czech Republic, the two
views are roughly in balance. Only in economi-
cally struggling Italy does the majority continue
to associate the EU with a drop in prosperity.
What is worse: the view is widespread there
100 %
90 %
80 %
70 %
60 %
50 %
40 %
30 %
20 %
10 %
0 %
22
10
13
14
27
25
23
34
34
28
23
23
33
23
31
33
30
33
44
64
59
52
43
38
35
31
25
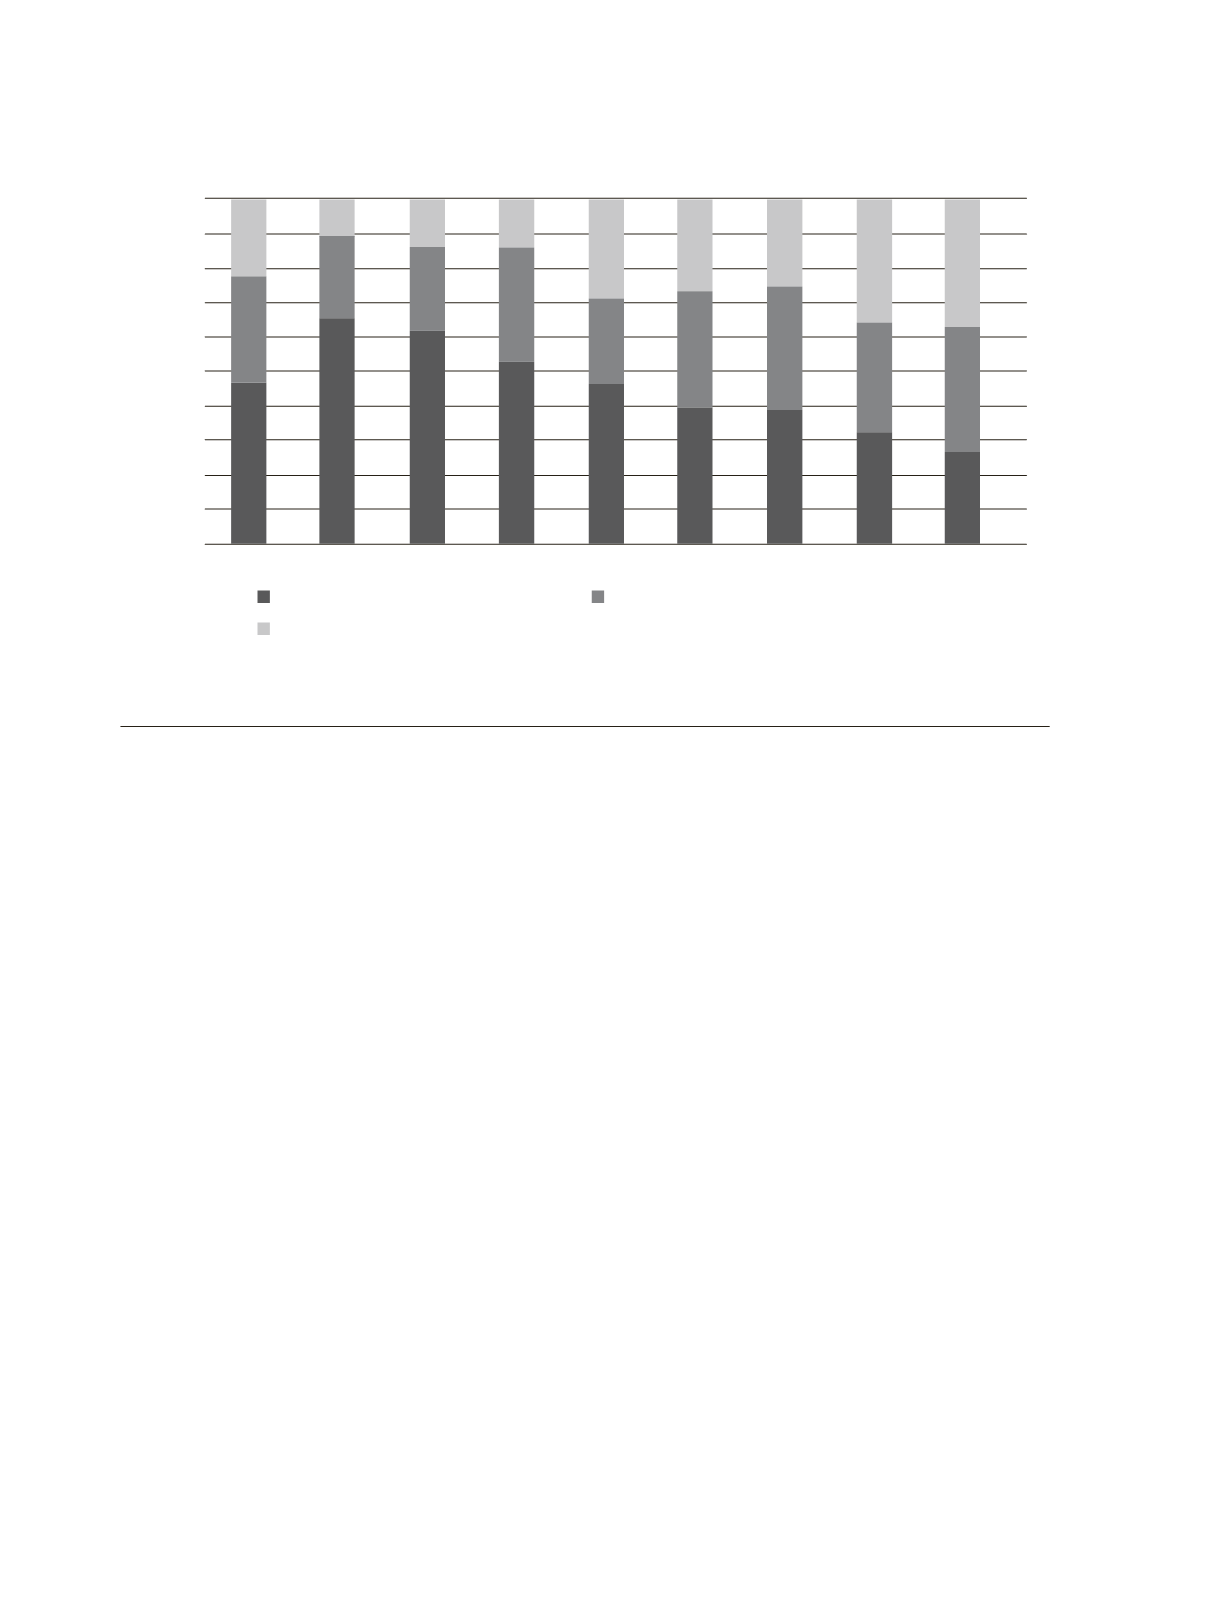
Total
Germany
Spain
Slovakia Sweden Netherlands France
Italy
Czech
Republic
Advantages exceed disadvantages
Disadvantages exceed advantages
Advantages, disadvantages even
Chart 2.
Question: When thinking of your country’s EU membership, would you say that advantages outweigh
disadvantages, or that disadvantages outweigh advantages, or that advantages and disadvantages are even?
Gap between figures shown and 100 percent is the equivalent of categories “do not know”, “prefer not to say”.
Basis: eligible voters in the individual countries.
Source:
policy matters
.