


 85 / 145

INEQUALITY IN EUROPE: UNEQUAL TRENDS
85
people altogether, we obtain more realistic and
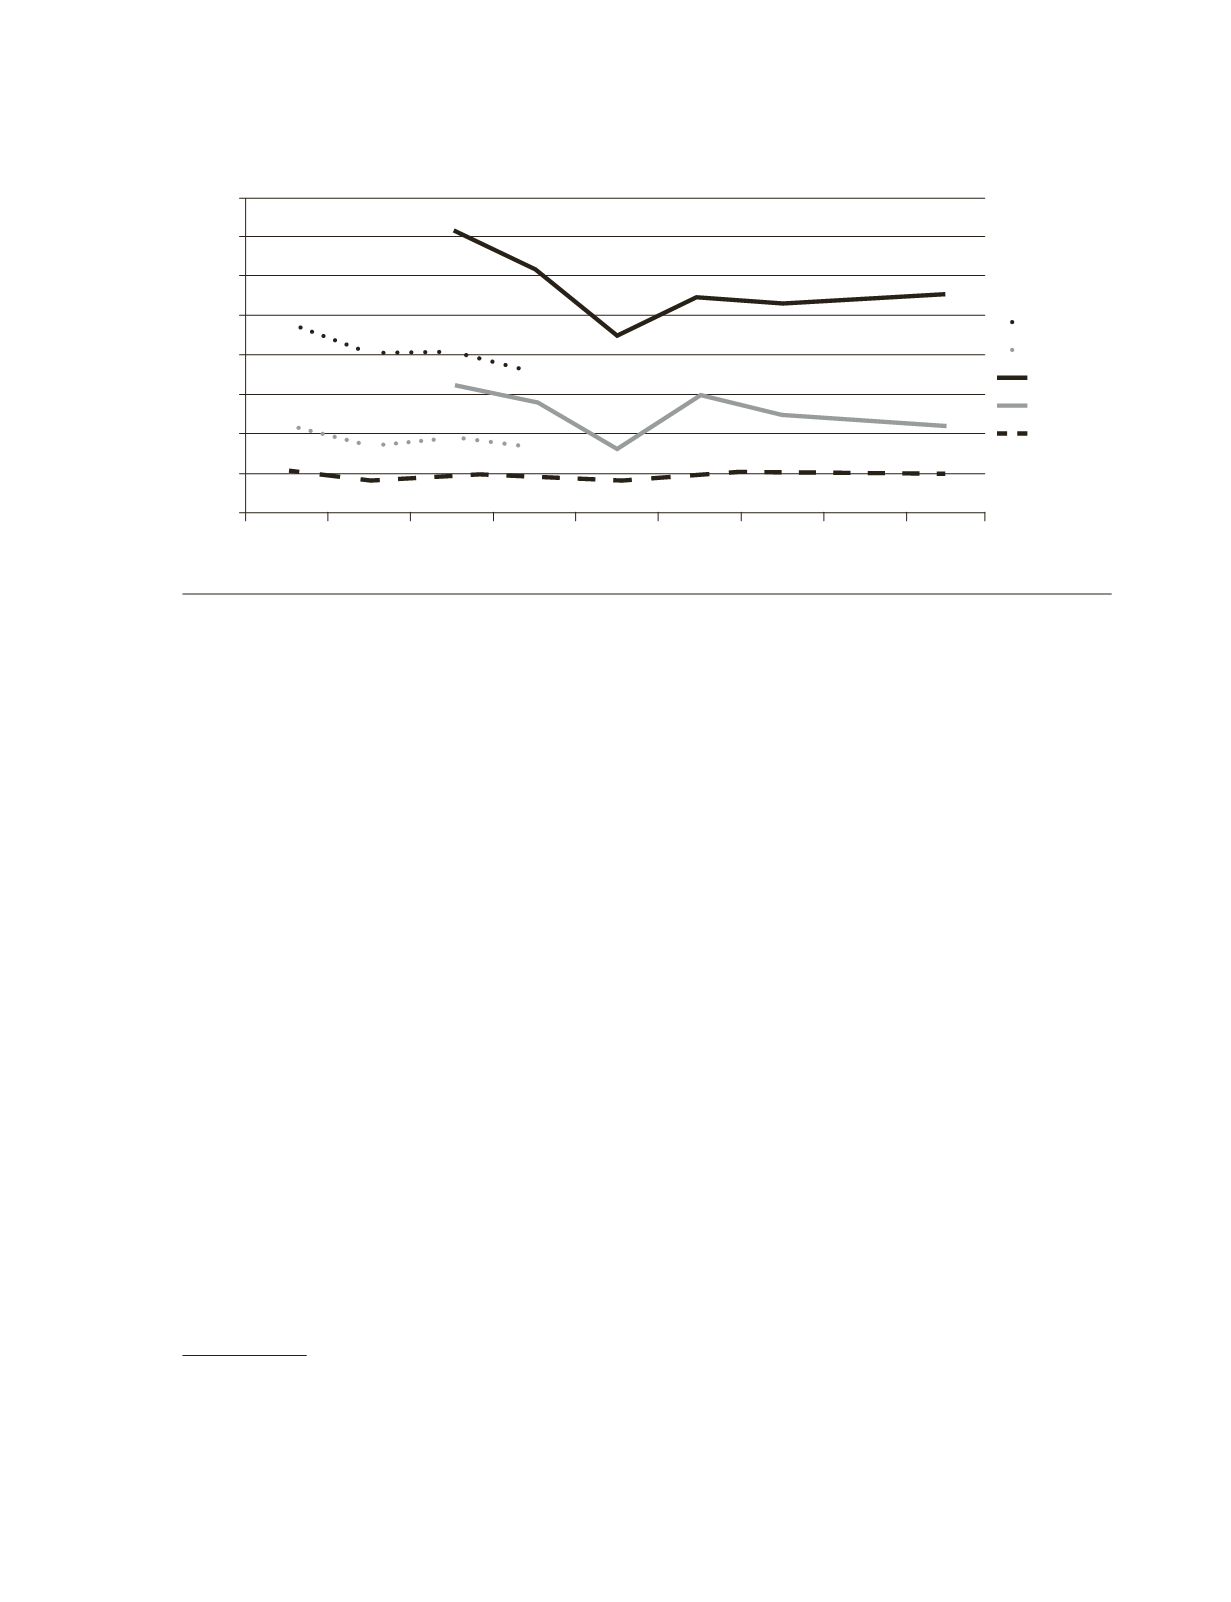
clearly higher values, as shown in
Chart 2
. The
values measured in purchasing power parities
also remain under those calculated in Euros (ac-
cording to the exchange rates). The value for
the EU-27 was 9.5 in 2013, 6.2 in purchasing
power parities. The corresponding values for
other large countries are 4.9 for India, 7.3 for
Russia, 8.4 for the USA and 9.6 for China.
7
At
least in relation to exchange rates, the EU eco-
nomic area is characterised by higher income
disparities than the corresponding national
economies. In the course of time, we observe a
significant decrease of inequality until 2009 that
shortly increases during the recession to finish
up in a stagnant development (see
Chart 2
).
Aside from comparing people, households
or groups Europe-wide as we do when compar-
ing quintiles, we can study regions as well. It
7
According to the UN Human Development Report (http://
hdr.undp.org/sites/default/files/reports/14/hdr2013_en_
complete.pdf).
must be said that income differences within re-
gions are usually higher that within income
quintiles; by definition, those are composed by
similar people or households inside specific in-
come levels. In order to keep the number of re-
gions manageable, we’ll concentrate only on
the EU NUTS2 regions. As already mentioned,
the dispersion of the regional income per head
has increased between 2000 and 2012 (cf.
Chart 3
). The dispersion decreased only in the
period 2008-09 due to the crisis.
It’s also possible to build the poorest and the
richest quintile by using regions, by classifying
the NUTS-2 areas according to their income per
head and taking again as many regions from the
poorest or the richest respectively as necessary
to reach approximately 100 million inhabitants.
This results in a regional S80/S20 ratio of almost
4 in the year 2000 and 2.8 in 2011. Here again,
the catching-up development in the CEE leads
to a reduction of inequality. Nevertheless, re-
gional inequality has increased in total, since –as
opposed to the study of quintiles– the increase
in inequality between regions within countries is
12
11
10
9
8
7
6
5
4
2005 2006 2007 2008 2009 2010 2011 2012 2013
EU-27
EU-25
EU-25
EU-27
EU-27
Chart 2.
Development of inequality in the EU.
Source:
Dauderstädt/Keltek, 2014.