


 86 / 145

THE STATE OF THE EUROPEAN UNION
86
higher than the decrease in the inequality be-
tween countries.
If the Europe-wide inequality were measured
by forming the EU quintiles with approximately
100 million people each through different ways
and subsequently calculating the ratio between
the income of the richest and the poorest quin-
tile, we would obtain other S80/S20 values, de-
pending on the approach.
1. If we added up complete countries (or parts
of them) so as to form the EU quintiles, we
wouldn’t take into account the inequality
within each one of those countries.
2. If we added up regions so as to form the
EU quintiles, we wouldn’t take into ac-
count the inequality within each region.
3. ����������������������������������������
If we added up the poorest and the rich-
est quintiles of every country, in the same
way the official Eurostat value does, we
wouldn’t take into account the inequality
between countries.
4. Our approach (
Tables 8
and
9; Chart 2
)
takes both dimensions into consideration
(1 and 3).
The following
Table 10
shows an overview
of the different approaches and their resulting
values and modifications. In the 1
st
and the 4
th
approach, values are shown in purchasing pow-
er parities (PPP) and exchange rates (
€
).
The Europe-wide inequality has decreased in
all approaches except in the official (methodi-
cally wrong) Eurostat value, in which the grow-
ing internal inequality of the states controls the
trend because catch-up processes are not taken
into account.
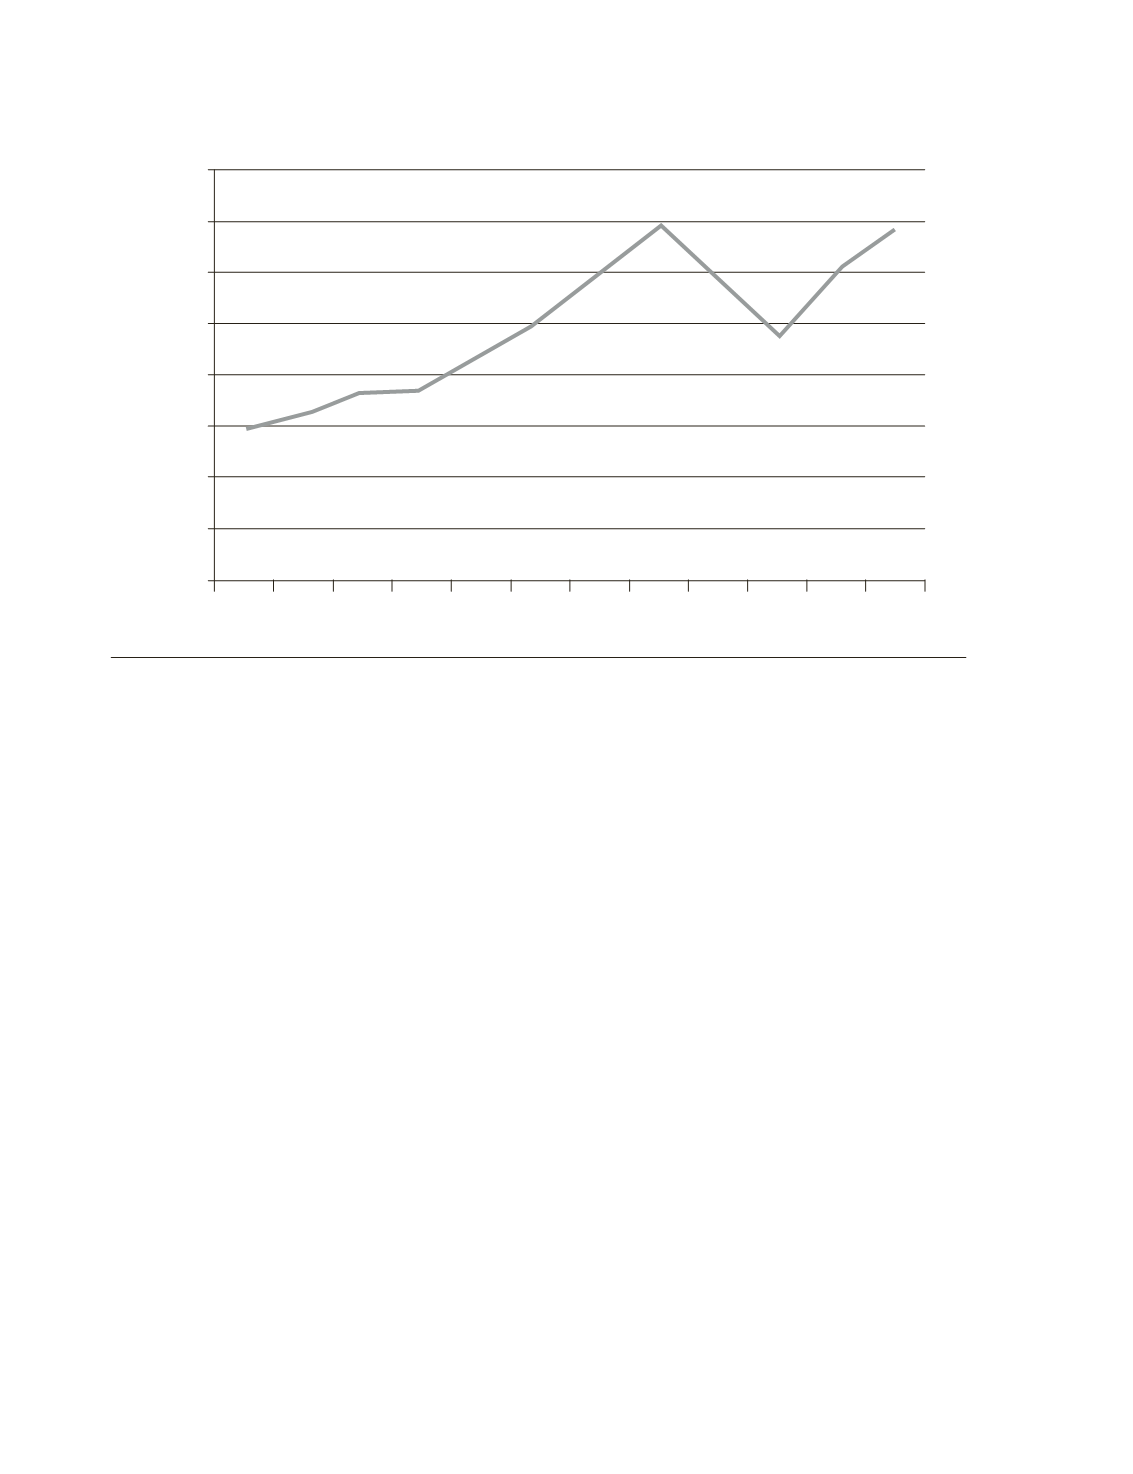
Chart 3.
Development of the dispersion (standard deviation) of the regional income per head (in €).
Source:
Eurostat and author’s calculations.
2000 2001 2002 2003 2004 2005 2006 2007 2008 2009 2010 2011
13000
12500
12000
11500
11000
10500
10000
9500
9000