


 83 / 145

INEQUALITY IN EUROPE: UNEQUAL TRENDS
83
internal distribution is relatively unimportant
for the income distribution in the whole
European economic area. Its development is
dominated by the income differences between
countries, and their development by the diverse
growth rates of the corresponding national
economies.
In order to gain an image of the real inequal-
ity in the EU, the development of income distri-
bution between and within states needs to be
connected. A good tool could be the quintile
share ratio (S80/S20), since Eurostat, the
Statistical Office of the EU, calculates the in-
come per head of every population quintile in
every Member State in Euros and PPP.
Nevertheless, the 5.2 indicated by the EU as
mean value for the EU-28 (2014; see
Table 2
),
is calculated by a wrong method and thus se-
verely underestimates the real inequality in the
EU. Eurostat calculates this quintile share ratio
precisely as the average (weighted by popula-
tion) of all national S80/S20 values. This ap-
proach assumes that the richest (or the poorest)
EU-quintile (about 100 million people) is com-
posed by the richest (or the poorest) quintiles of
all Member States. In fact, the poorest 100 mil-
lion mainly live in CEE, especially in Romania
and Bulgaria, where not only a fifth but closer
to four fifths of the population belong to the
poorest EU-quintile (see
Tables 8
and
9
).
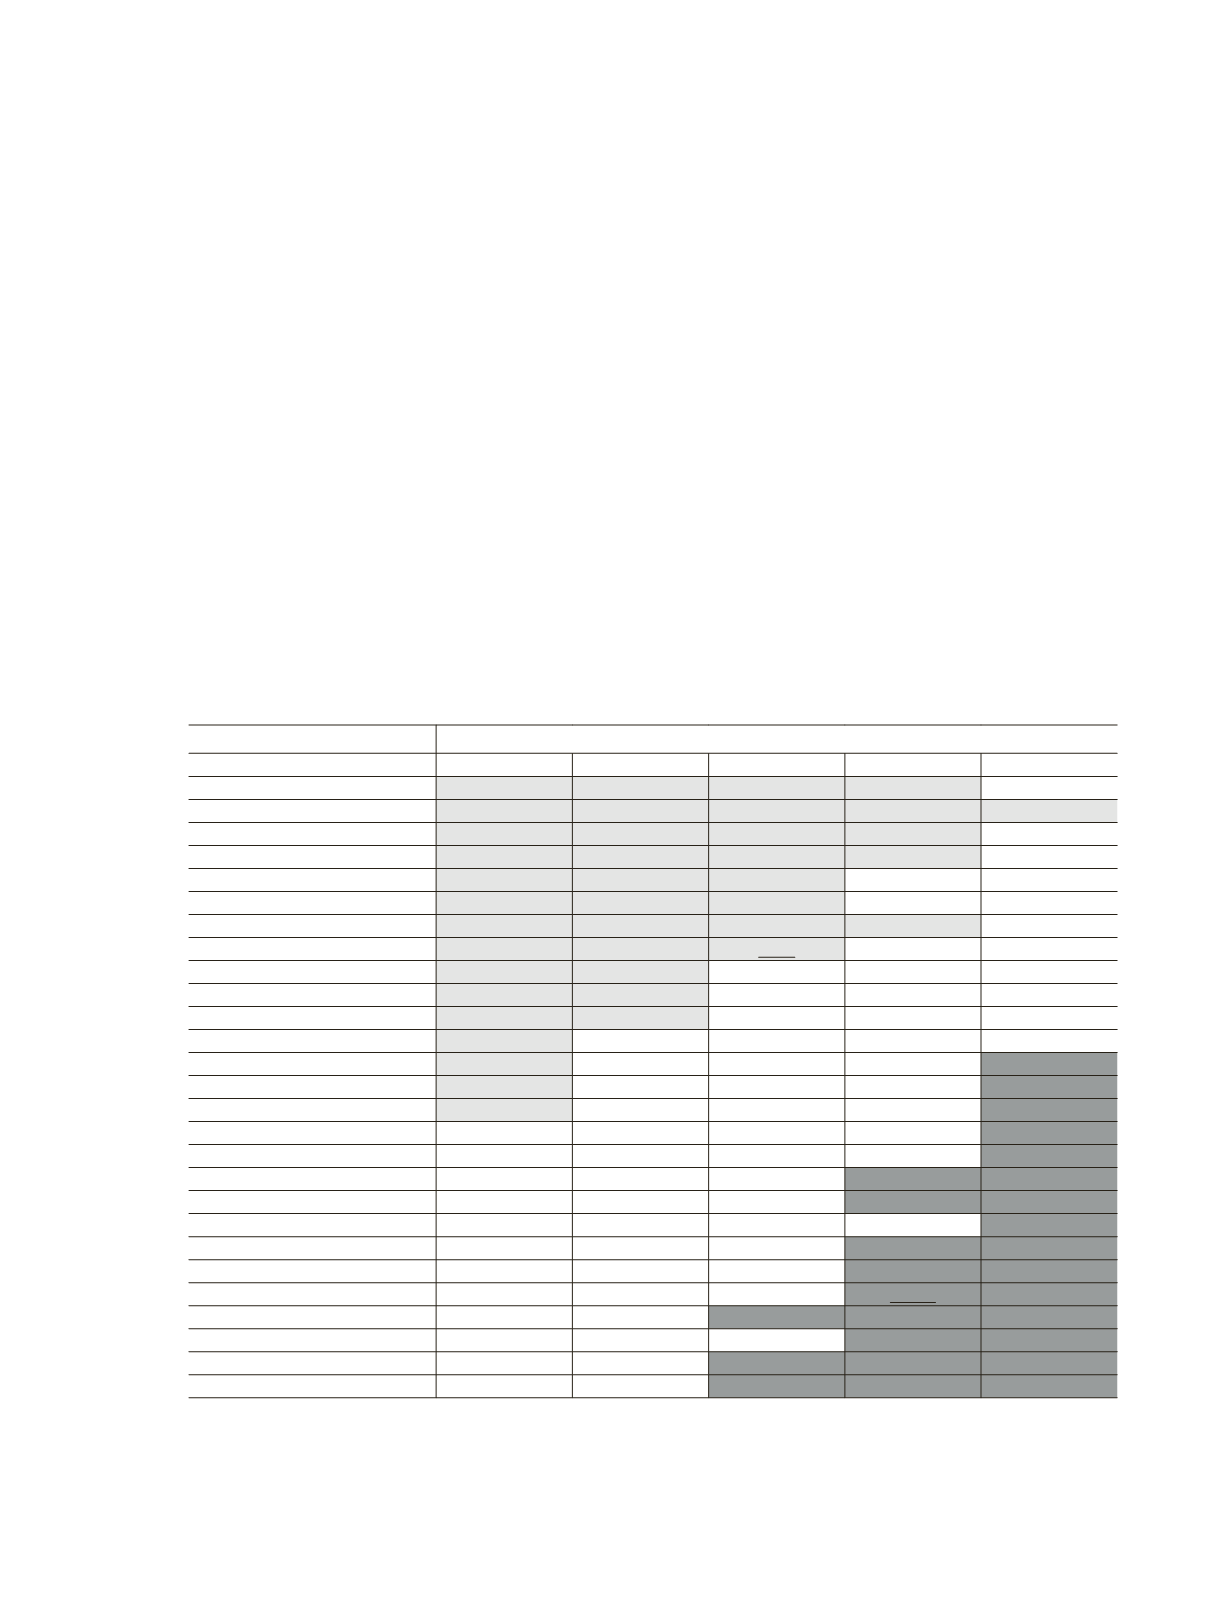
Table 8.
The poorest (light grey) and richest (dark grey) EU-quintiles (in €).
2013
Income per capita in
€
Member State
Q1
Q2
Q3
Q4
Q5
Bulgaria
1123
2129
2942
3960
7389
Romania
727
1450
2071
2828
4759
Latvia
1902
3386
4696
6648
12017
Lithuania
1953
3398
4676
6419
11785
Poland
2380
3923
5184
6782
11602
Estonia
2859
4847
6595
9100
15824
Hungary
2271
3585
4542
5724
9511
Slovakia
3415
5506
6765
8409
12231
Czech Republic
4503
6406
7708
9544
15308
Portugal
3425
6177
8222
11095
20568
Greece
2873
5716
8212
10846
18846
Malta
5998
9099
12045
15371
24664
Spain
4986
9765
13590
18472
31358
Slovenia
6020
9476
11865
14536
21616
Italy
6167
11558
15737
20590
35264
Cyprus
8113
12117
15874
21233
39754
Germany
9324
15176
19607
25355
42890
France
10905
16618
21039
26675
48604
Belgium
10662
16520
21511
27121
40548
United Kingdom
8982
14078
18691
24934
41573
Austria
10642
17519
22128
27803
43723
Finland
12704
18590
23376
29248
45581
Netherland
11342
16929
20882
25859
40606
Sweden
12832
20860
26425
32387
47861
Ireland
9633
14916
19893
27511
50416
Denmark
12518
21343
26910
33360
53015
Luxemburg
16239
24987
33147
43275
74516
Source:
Eurostat and author’s calculations.
Remark: both underlined quintiles are included in the corresponding EU-quintile only in proportion.