


 84 / 145

THE STATE OF THE EUROPEAN UNION
84
Tables 8
and
9
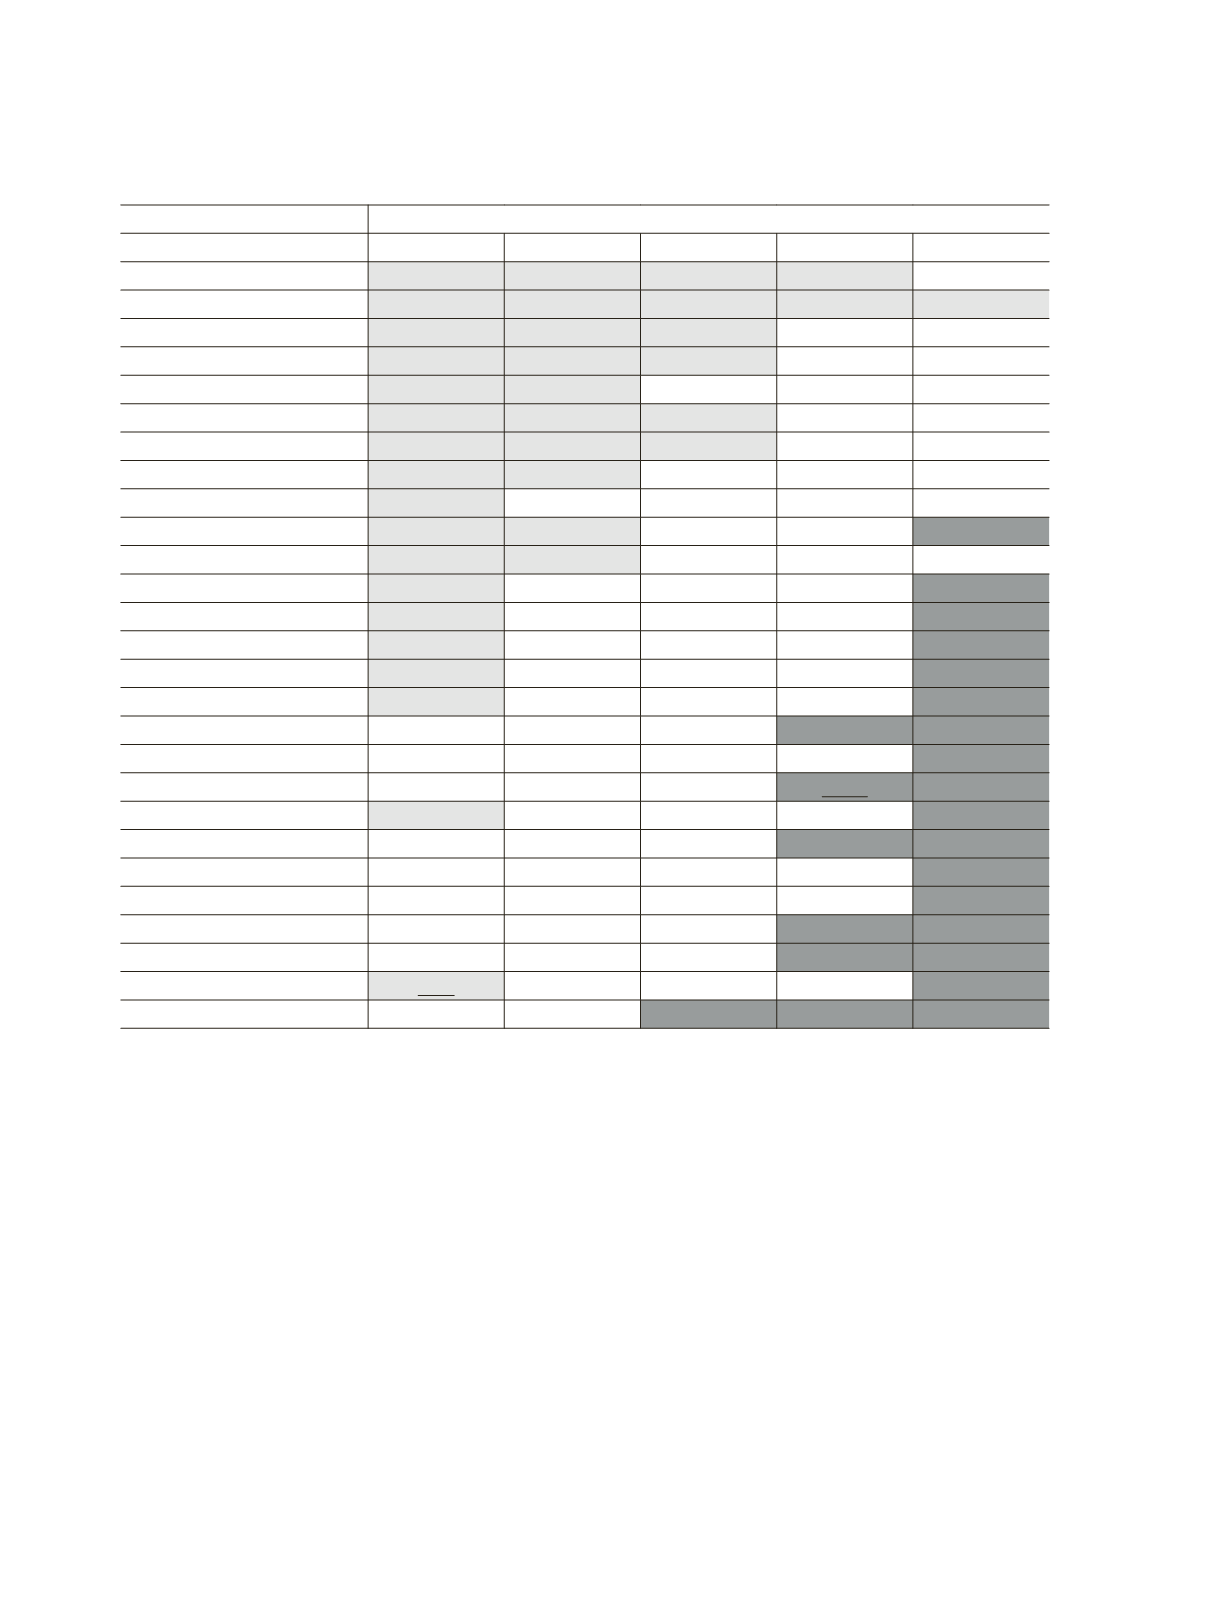
show the combination of the
inequality within and between countries. In the
rows, we can see the national quintile share ra-
tios that result from dividing the income in the
richest quintile (Q5) by the income in the poor-
est quintile (Q1). The gap between the richest
and the poorest quintile in the EU as a whole is
huge. At exchange rates, the ratio of the
Romanian Q1 to the Luxembourger Q5 is
€
727
to
€
74,516, which means more than a hundred
times higher and even forty-five times higher in
purchasing power parities! It must be said that
this valuation doesn’t take into account the dis-
tribution within the quintile either.
To correct this wrong Eurostat approach, by
arranging national quintiles by income per head
and subsequently adding as many national
quintiles to the richest EU-quintile from the top
and to the poorest quintile from the bottom (as
in Tables 8 and 9), until we had 100 million
Table 9.
The poorest (light grey) and richest (dark grey) EU-quintiles (in PPP)
2013
Income per capita in PPP
Member State
Q1
Q2
Q3
Q4
Q5
Bulgaria
2292
4345
6003
8081
15081
Romania
1346
2685
3834
5237
8813
Latvia
2671
4756
6596
9337
16877
Lithuania
3075
5350
7364
10109
18559
Poland
4265
7031
9291
12154
20792
Estonia
3661
6206
8445
11652
20262
Hungary
3804
6006
7608
9588
15932
Slovakia
4921
7933
9748
12117
17624
Czech Republic
6555
9325
11220
13893
22282
Portugal
4213
7598
10113
13647
25299
Greece
3221
6409
9206
12159
21128
Malta
7271
11029
14600
18631
29896
Spain
5333
10444
14534
19756
33538
Slovenia
7244
11403
14278
17493
26012
Italy
5976
11200
15249
19951
34170
Cyprus
8876
13257
17367
23231
43495
Germany
9114
14835
19166
24785
41926
France
9932
15134
19162
24295
44266
Belgium
9622
14910
19414
24478
36595
United Kingdom
7838
12285
16310
21757
36276
Austria
9927
16342
20642
25936
40786
Finland
10320
15101
18989
23760
37028
Netherland
10209
15238
18796
23276
36549
Sweden
9750
15851
20080
24610
36368
Ireland
9633
14916
19893
27511
50416
Denmark
8980
15310
19304
23931
38031
Luxemburg
13376
20583
27304
35647
61380
Source:
Eurostat and author’s calculations. Remark: both underlined quintiles are included in the corresponding EU-quintile only in proportion.